
Last week, the Google Ads team presented Google Ads MCP. For me personally, it was one of the most anticipated updates of this autumn (yes, there have been unofficial MCPs for Google Ads for quite some time, but the official one is still the official one — and it marks the real move of Google’s team in this direction).
This news quickly spread across news groups and chats — both among those working with advertising and within analytics communities. However, apart from the announcement itself, I haven’t seen a single example of practical use.
It even reminded me a bit of the period when GA4 had just appeared: news about its updates spread fast, but there were almost no real, detailed, and practical materials. Back then, I tried to write and record videos about GA4 — and I’ll try to do the same now with MCP. Just like with GA4, I believe most of us will come to use the MCP technology over time. Some sooner, some later — but eventually everyone will, because it truly deserves your attention.
In this article, you’ll find several examples of how to use this technology in practice right now, and at the end — my reflections on the advantages, limitations, and the future of MCP.
What is Model Context Protocol?
I’ve already written in more detail on the blog about what Model Context Protocol is and why it represents the future of analytics, so here I’ll just give a brief explanation.
Model Context Protocol (MCP) is a protocol that allows your favorite LLM (ChatGPT, Claude, Gemini, Mistral…) to use the APIs of your favorite services — Google Analytics, Google Ads, BigQuery, Power BI, and others.
How can this be useful for you? Let’s take a look in practice.
Building a report on Google Ads data using Google Ads MCP based on a screenshot from another report
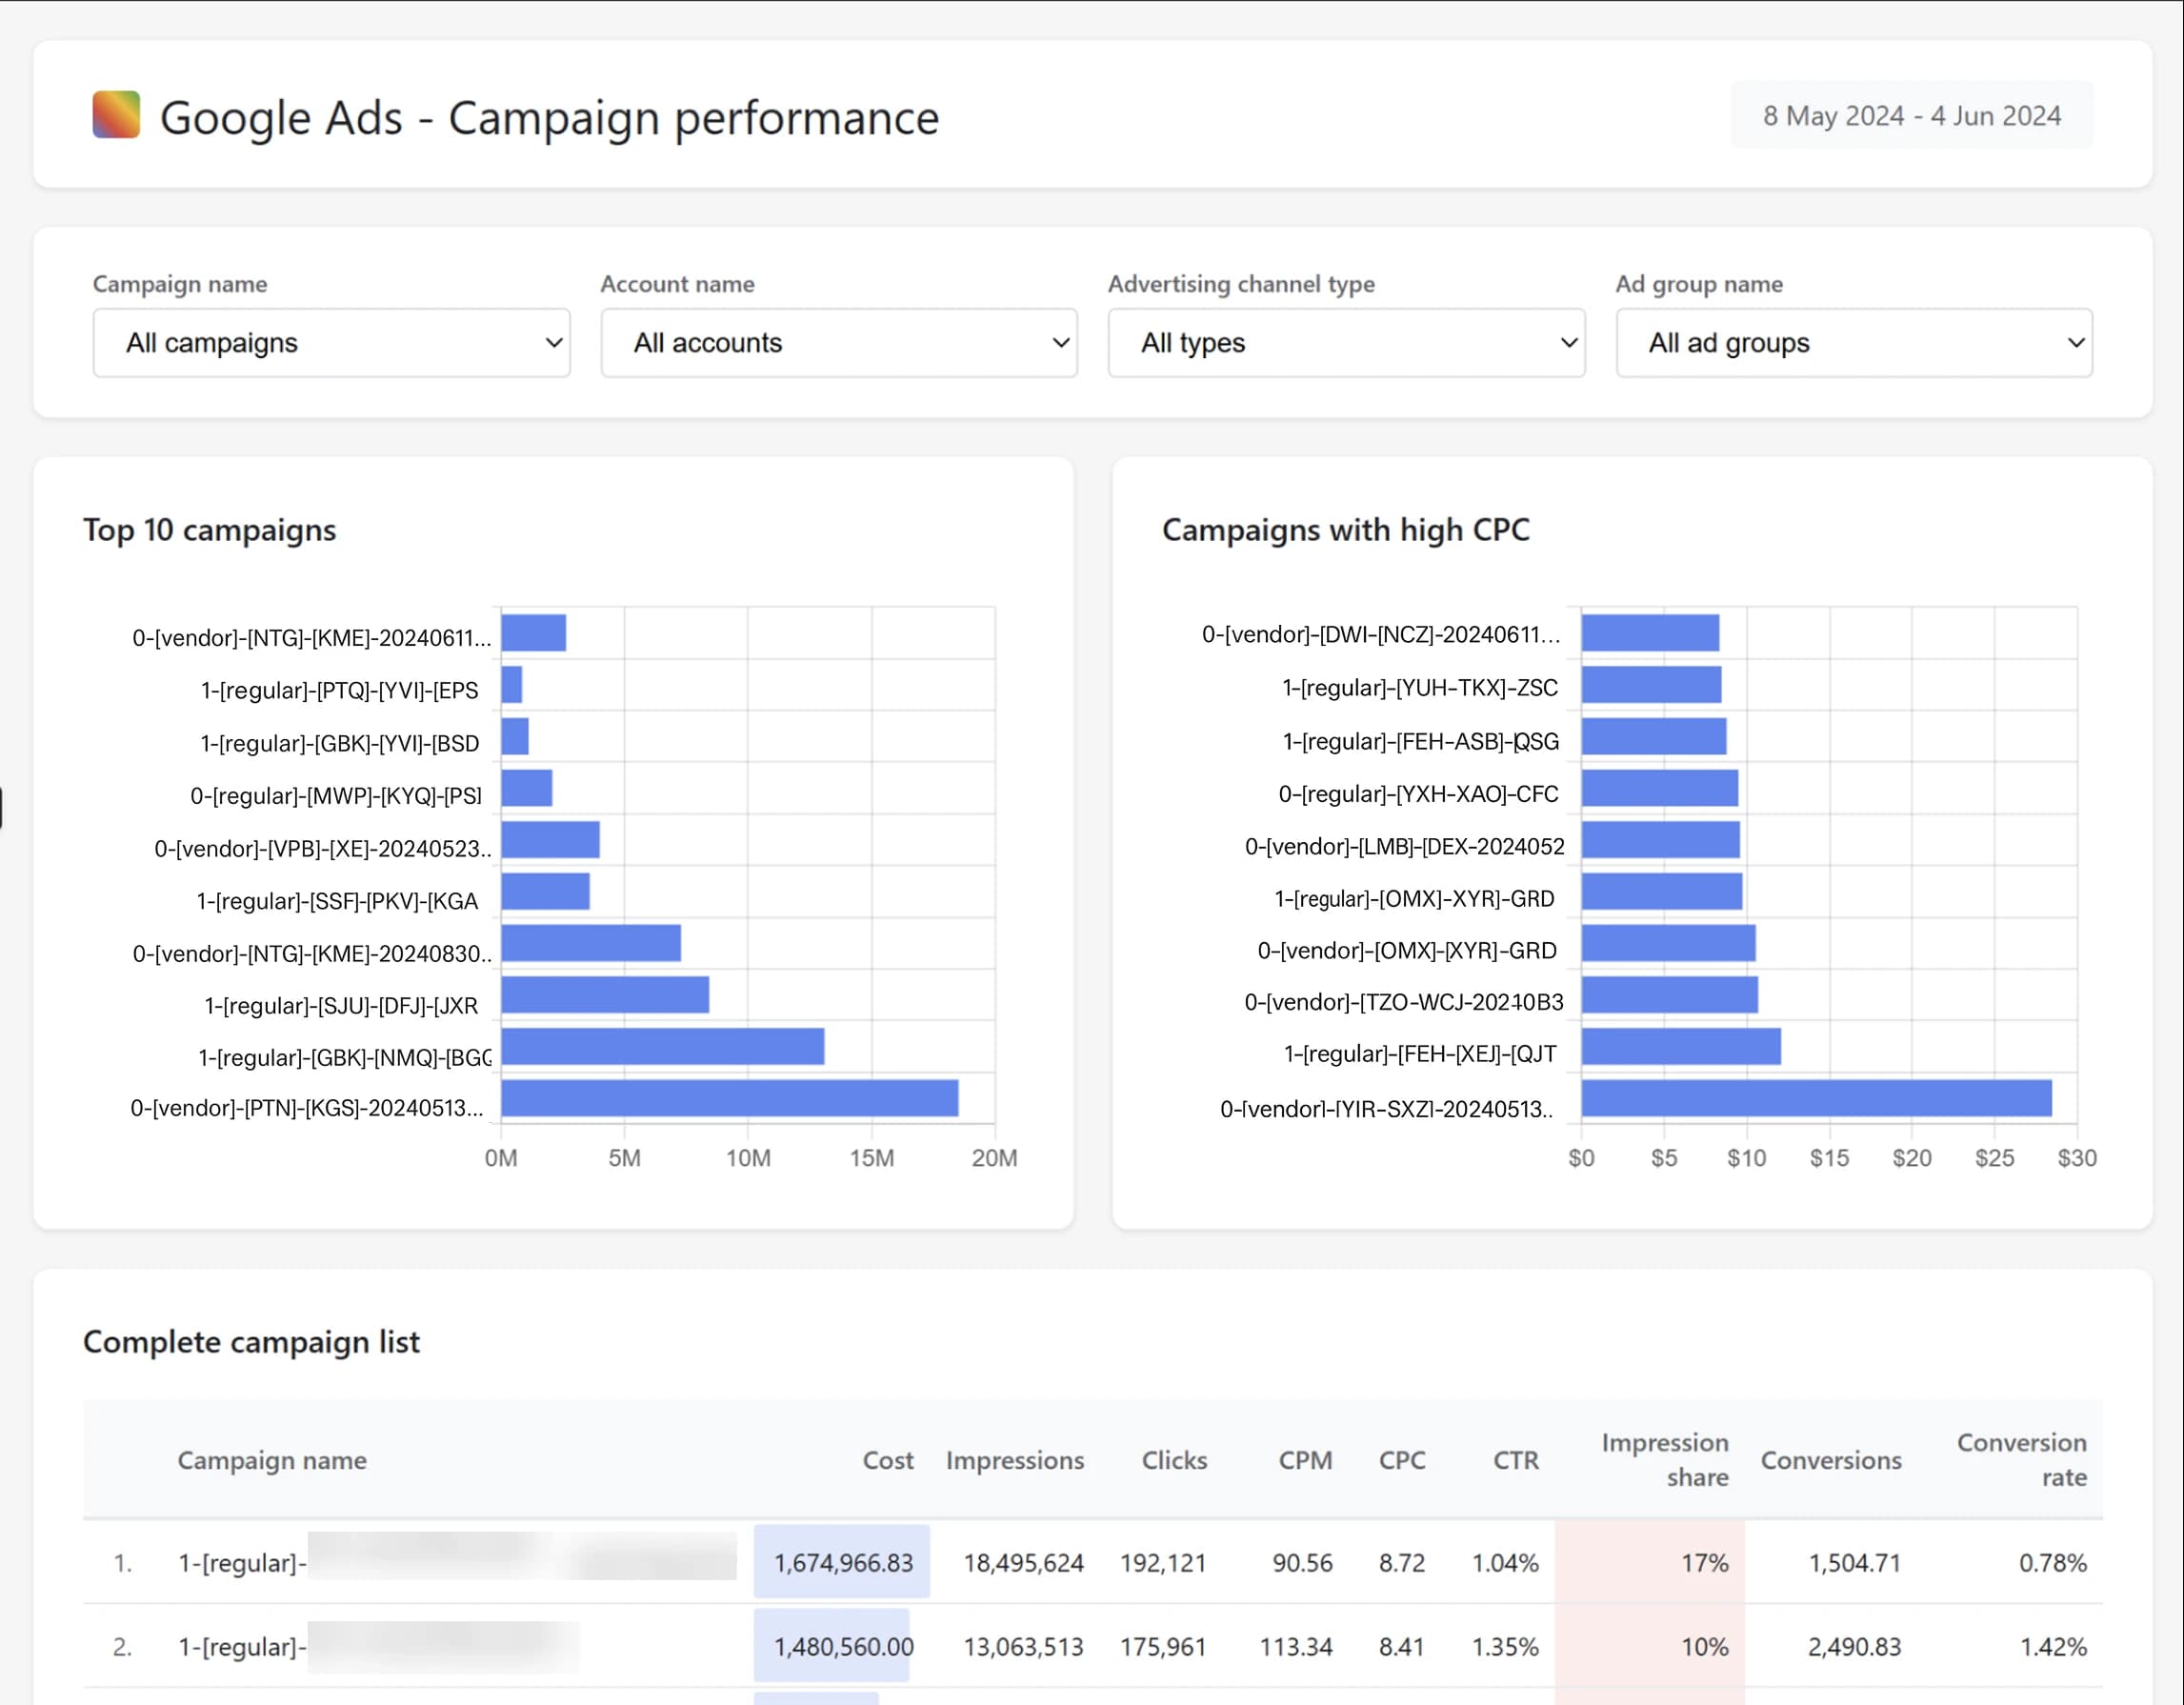
Imagine the following situation: you need to prepare a report for a client. The client wants a visually appealing and informative report. A simple Google Sheet won’t do, and screenshots from the interface won’t work either. Of course, you could go to Looker Studio and build it there. But there’s an easier way — use Google Ads MCP and get a report like this in just 2 minutes.
If the report in the screenshot below doesn’t look informative to you — I get it. But this is only an example to demonstrate the capabilities. Keep reading about how it was created, and you’ll understand what I mean.
Here’s what I did step by step:
- I went online and googled “Looker Studio Google Ads template.”
- Opened the first suggested website and found a screenshot of this report there.
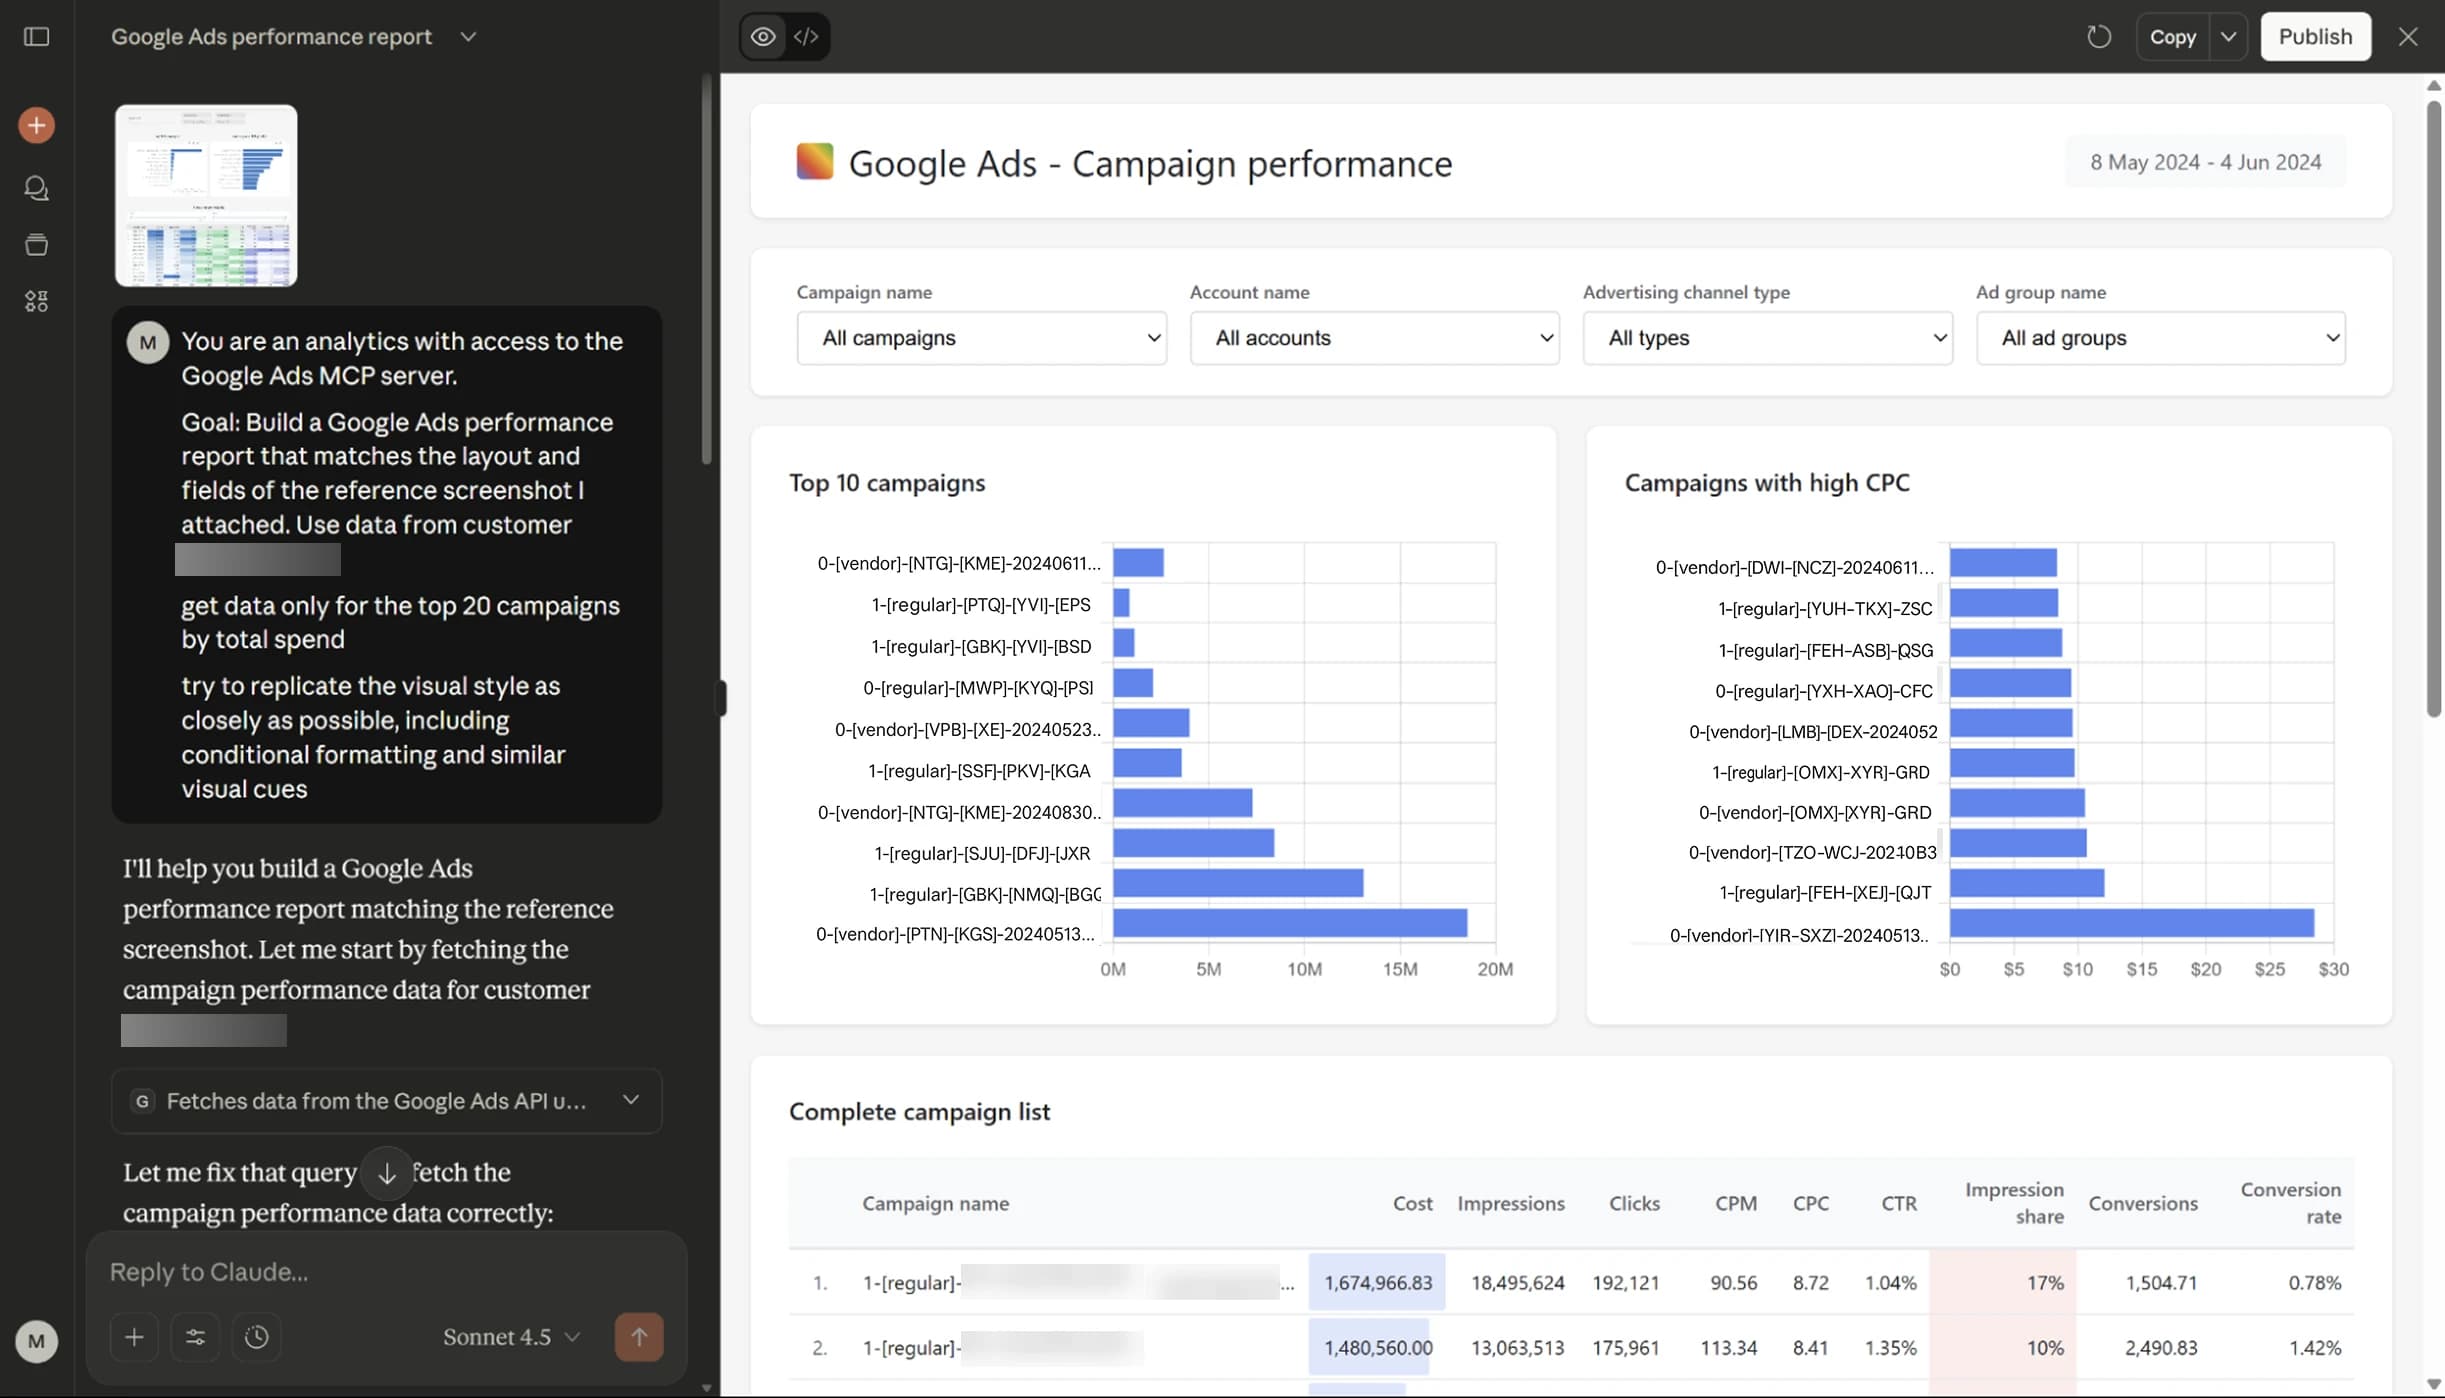
Then I uploaded the report screenshot to Claude and added the following prompt:
You are an analytics with access to the Google Ads MCP server.
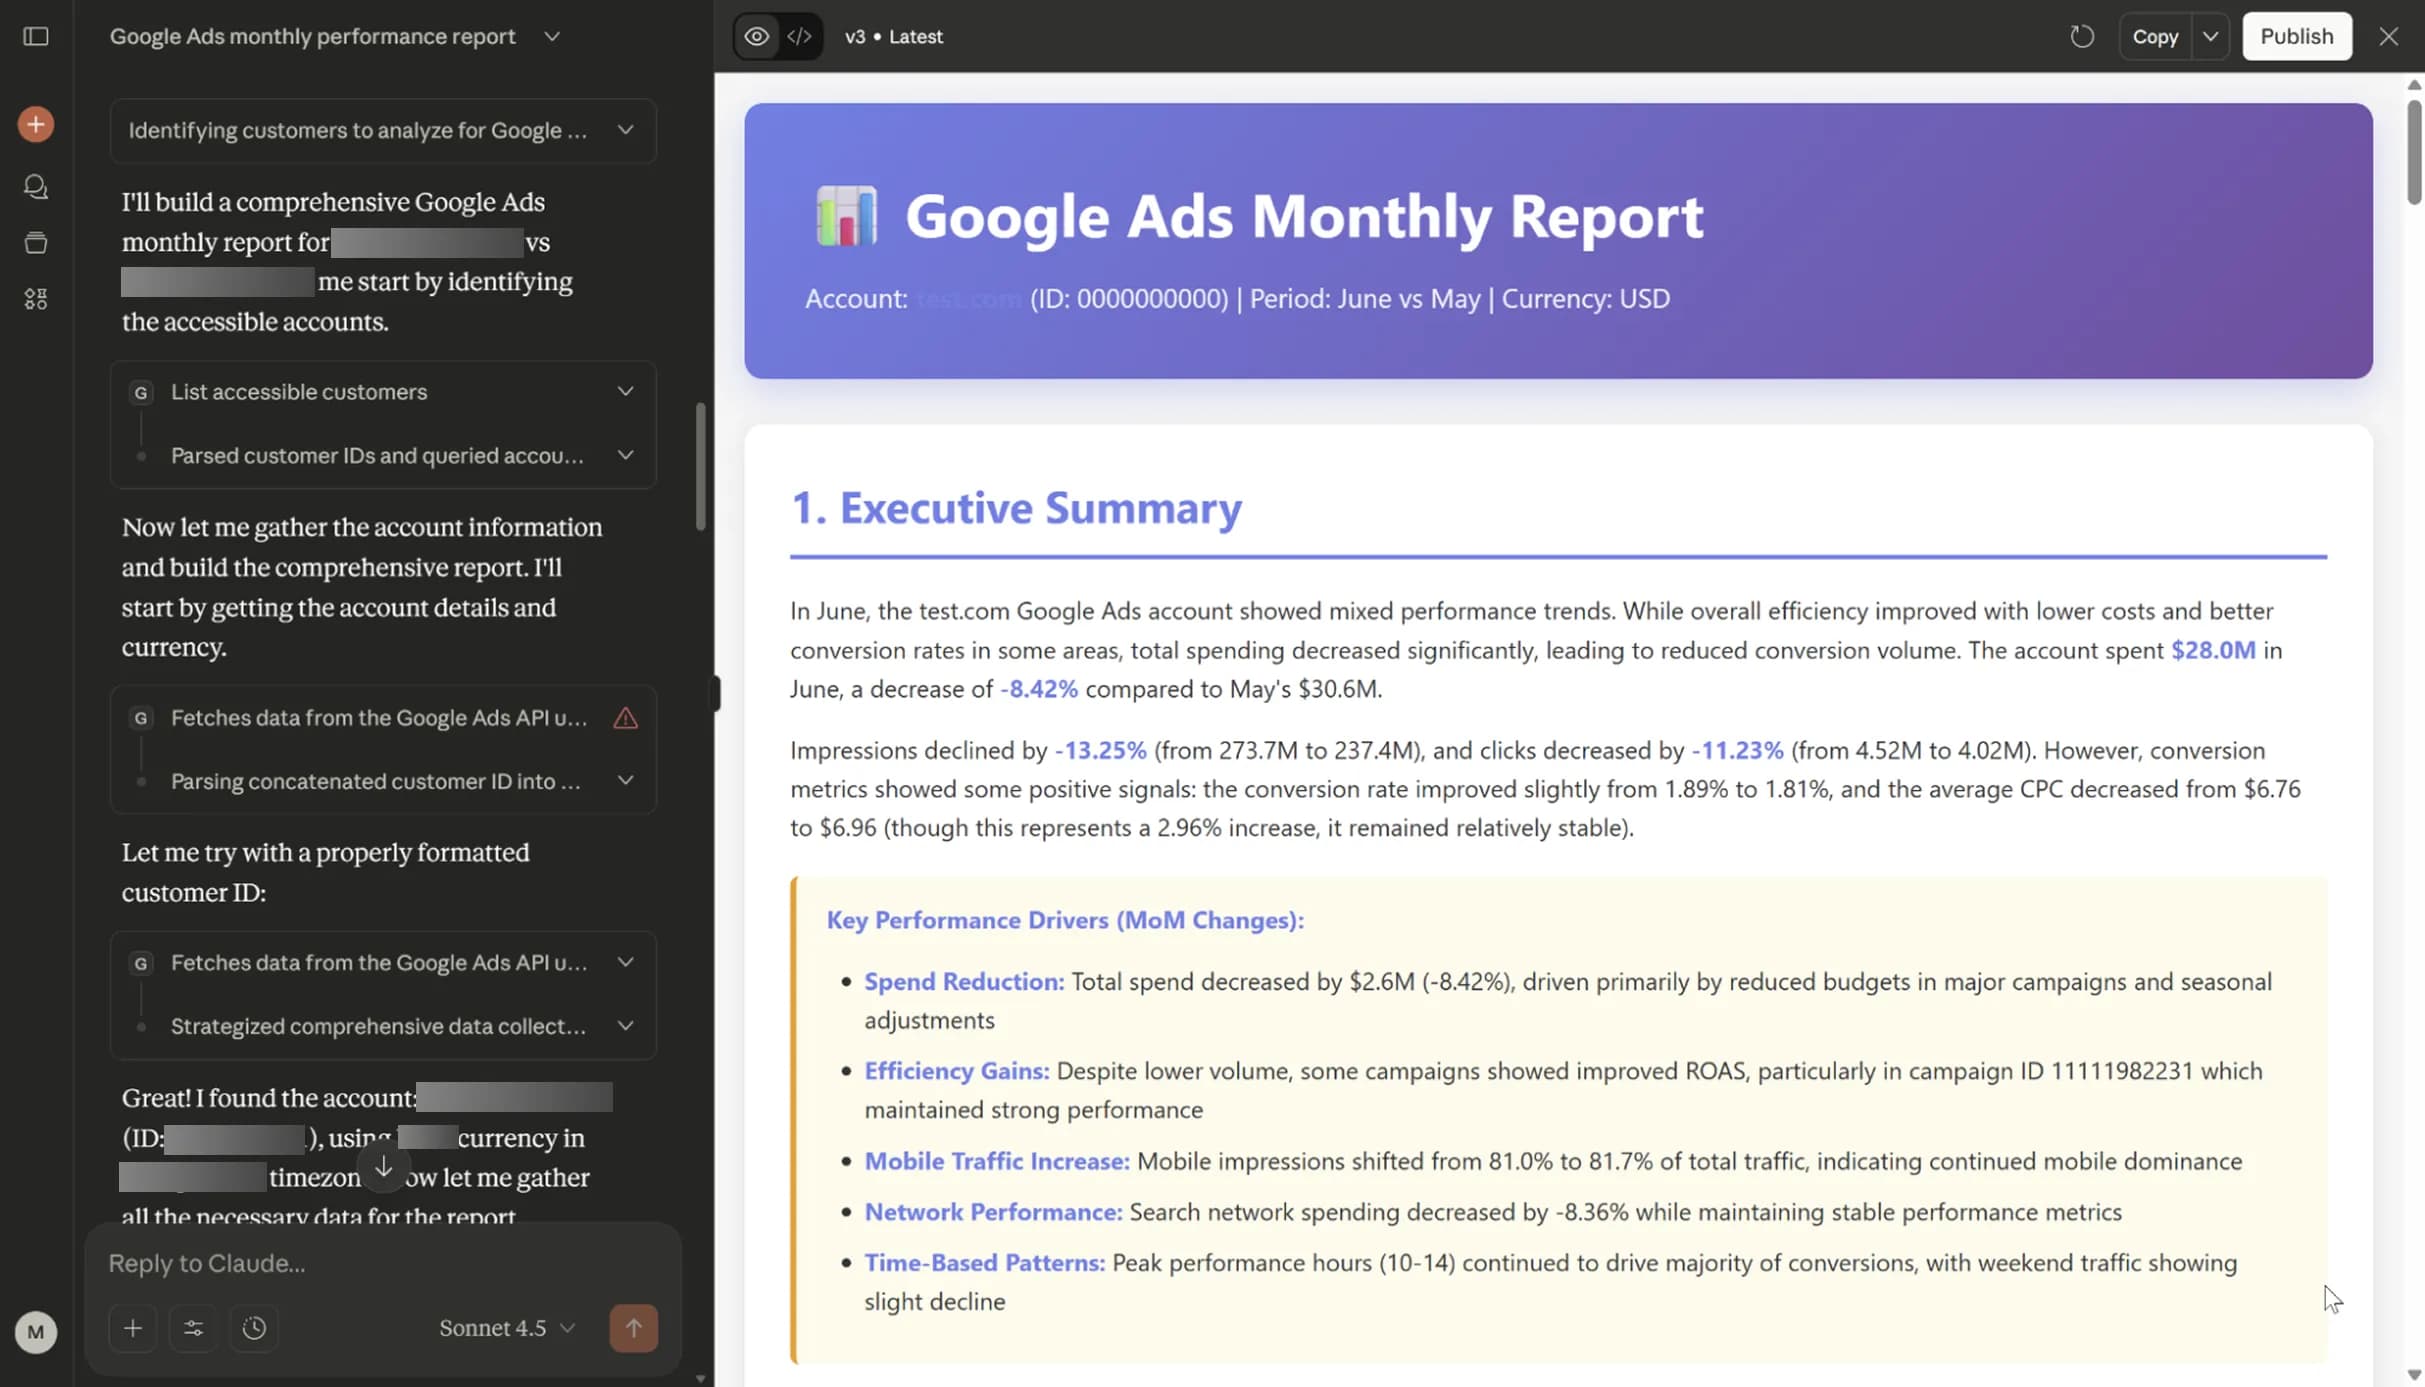
Goal: Build a Google Ads performance report that matches the layout and fields of the reference screenshot I attached. Use data from customer 000-000-0000.
Get data only for the top 20 campaigns by total spend. Try to replicate the visual style as closely as possible, including conditional formatting and similar visual cuesThe limitation of 20 campaigns was specified only to avoid pulling all data from the account. For demonstration purposes, 20 campaigns are more than enough.
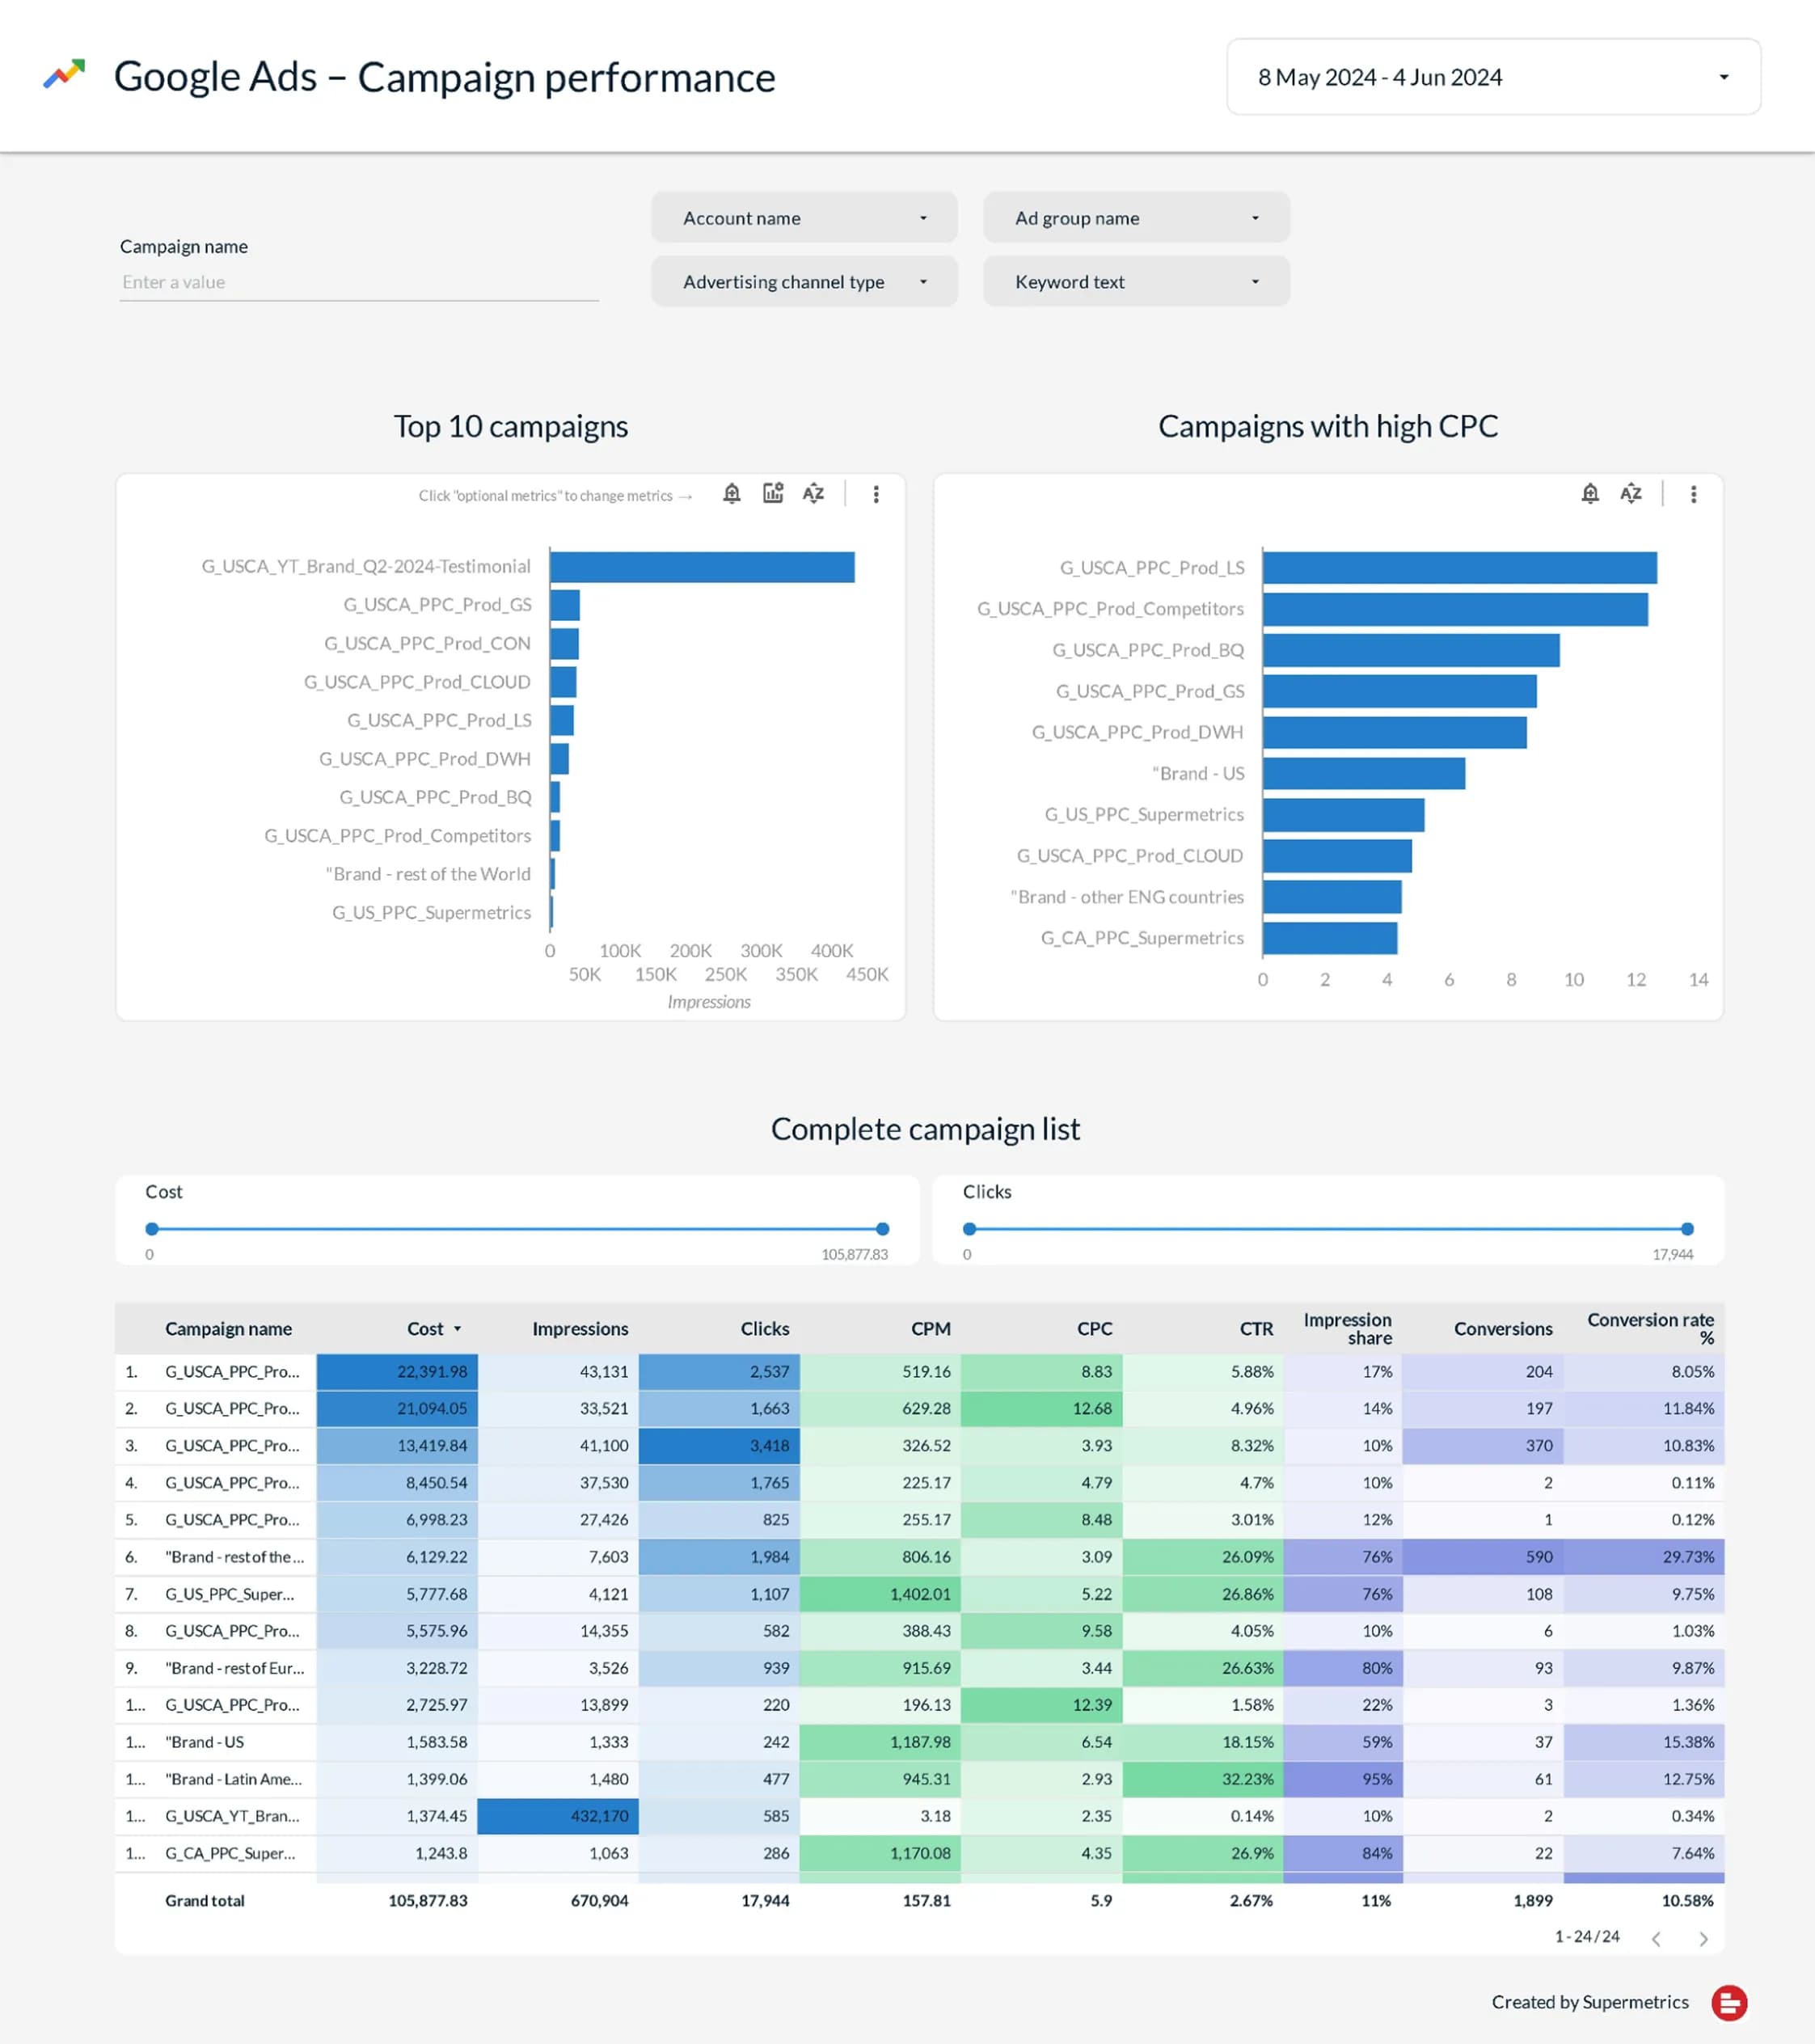
4. Waited about a minute while the report was being generated — and here’s the result.
First of all, as an analyst, I went to check how well the data in the report matched the data from the advertising account. And everything was spot on — all data was fetched via API and is accurate.
Let’s compare both versions:

What do you think? I’d say the result is very close to the original. Especially considering it was created in just 2 minutes. Yes, there are a few inconsistencies, such as the absence of a keyword filter and missing conditional formatting in some table columns — but nothing stops you from adding this functionality with the next prompt.
For those who still don’t believe that this was done with just one prompt — below is a full screenshot of the conversation:

Building a monthly client report based on your own prompt and Google Ads MCP
Creating a report from a screenshot is great — if you have that screenshot. But if you don’t, you can simply describe what you need in a prompt.
Of course, there are many useful materials about how to write the best prompts, but in this article, I want to emphasize the accessibility of the MCP technology. That’s why I decided not to write the prompt myself but to use ChatGPT for that.
Here’s what I entered:
Write a prompt for Claude for the following task:

Use Google Ads MCP to build a report. Use data from the account 000-000-0000.
This should be a prompt that clearly describes the report that needs to be created.

Design the report structure so that it fully covers the client’s monthly reporting needs. The analysis is conducted for PERIOD. For comparison, you can use data from PREVIOUS PERIOD.
And here’s what I got in response:
Role & Objective
You are an analyst with access to the Google Ads MCP Server. Build a complete monthly report for September 2025 with a comparison to August 2025 that fully satisfies the client’s account overview needs.
Time bounds (use the account’s time zone):
* September: 2025-09-01 … 2025-09-30
* August: 2025-08-01 … 2025-08-31
Use GAQL (Google Ads Query Language). When crafting queries, follow the standard pattern: a single resource in FROM, metrics via metrics.*, segments via segments.*, and sorting/filters with ORDER BY/WHERE. Verify field compatibility against the official docs (GAQL structure, segmentation, metrics).
Output
Return one self-contained HTML file (single file) with tables, visualizations, and concise bullet-point conclusions, including MoM deltas (Sep vs Aug) for key KPIs. Output all monetary values in the account’s currency (customer.currency_code). Use built-in API metrics (CTR, Avg CPC, Conv Rate, ROAS) wherever available to avoid manual calculations. Sort all “Top N” lists by spend (metrics.cost_micros).
Important: Wherever possible, display entity IDs in the report and try to avoid using names.
Report Structure (sections)
1. Executive Summary — 1–2 paragraphs + a bullet list of key MoM change drivers.
2. Account Overview (MoM) — KPIs for August and September.
3. Channel / Network Mix — distribution by networks.
4. Campaigns (Top-20 by Spend, MoM) — campaign table.
5. Campaigns — Winners & Laggards by Spend/CPA/ROAS.
6. Devices & Time — devices, days of week, hours.
7. Creatives / Ads — by ad types.
8. Performance Max (if present) — asset_group level.
9. Conversion Actions — contribution by conversion events.
10. Landing Pages — destination URLs with high spend / low CVR.
11. Budgets Context — daily budgets of active campaigns (reference).
12. Recommendations — a concise checklist of next-month actions.
Processing & Analysis
* Calculate MoM deltas (Sep vs Aug) for KPIs: Spend, Impr, Clicks, CTR, Avg CPC, Conversions, Conv Value, CVR, ROAS. Where possible, rely on built-in fields (metrics.ctr, metrics.average_cpc, metrics.conversions_from_interactions_rate, metrics.conversion_value_per_cost).
* Identify drivers of change: campaigns / networks / keywords / search terms / devices with the largest positive or negative impact.
* Detect waste: search terms and keywords with high spend and zero conversions in September.
* For Performance Max, show the highest-spend asset_group entries and their effectiveness.
* Add 5–10 specific Recommendations (negative keywords, device/time bid adjustments, budget reallocation across campaigns, creative tests, geo adjustments, etc.).
Additional Notes (important)
* All GAQL queries must follow the rules: one resource in FROM, compatible segments/metrics; use the official reference and Query Builder/Validator as needed.
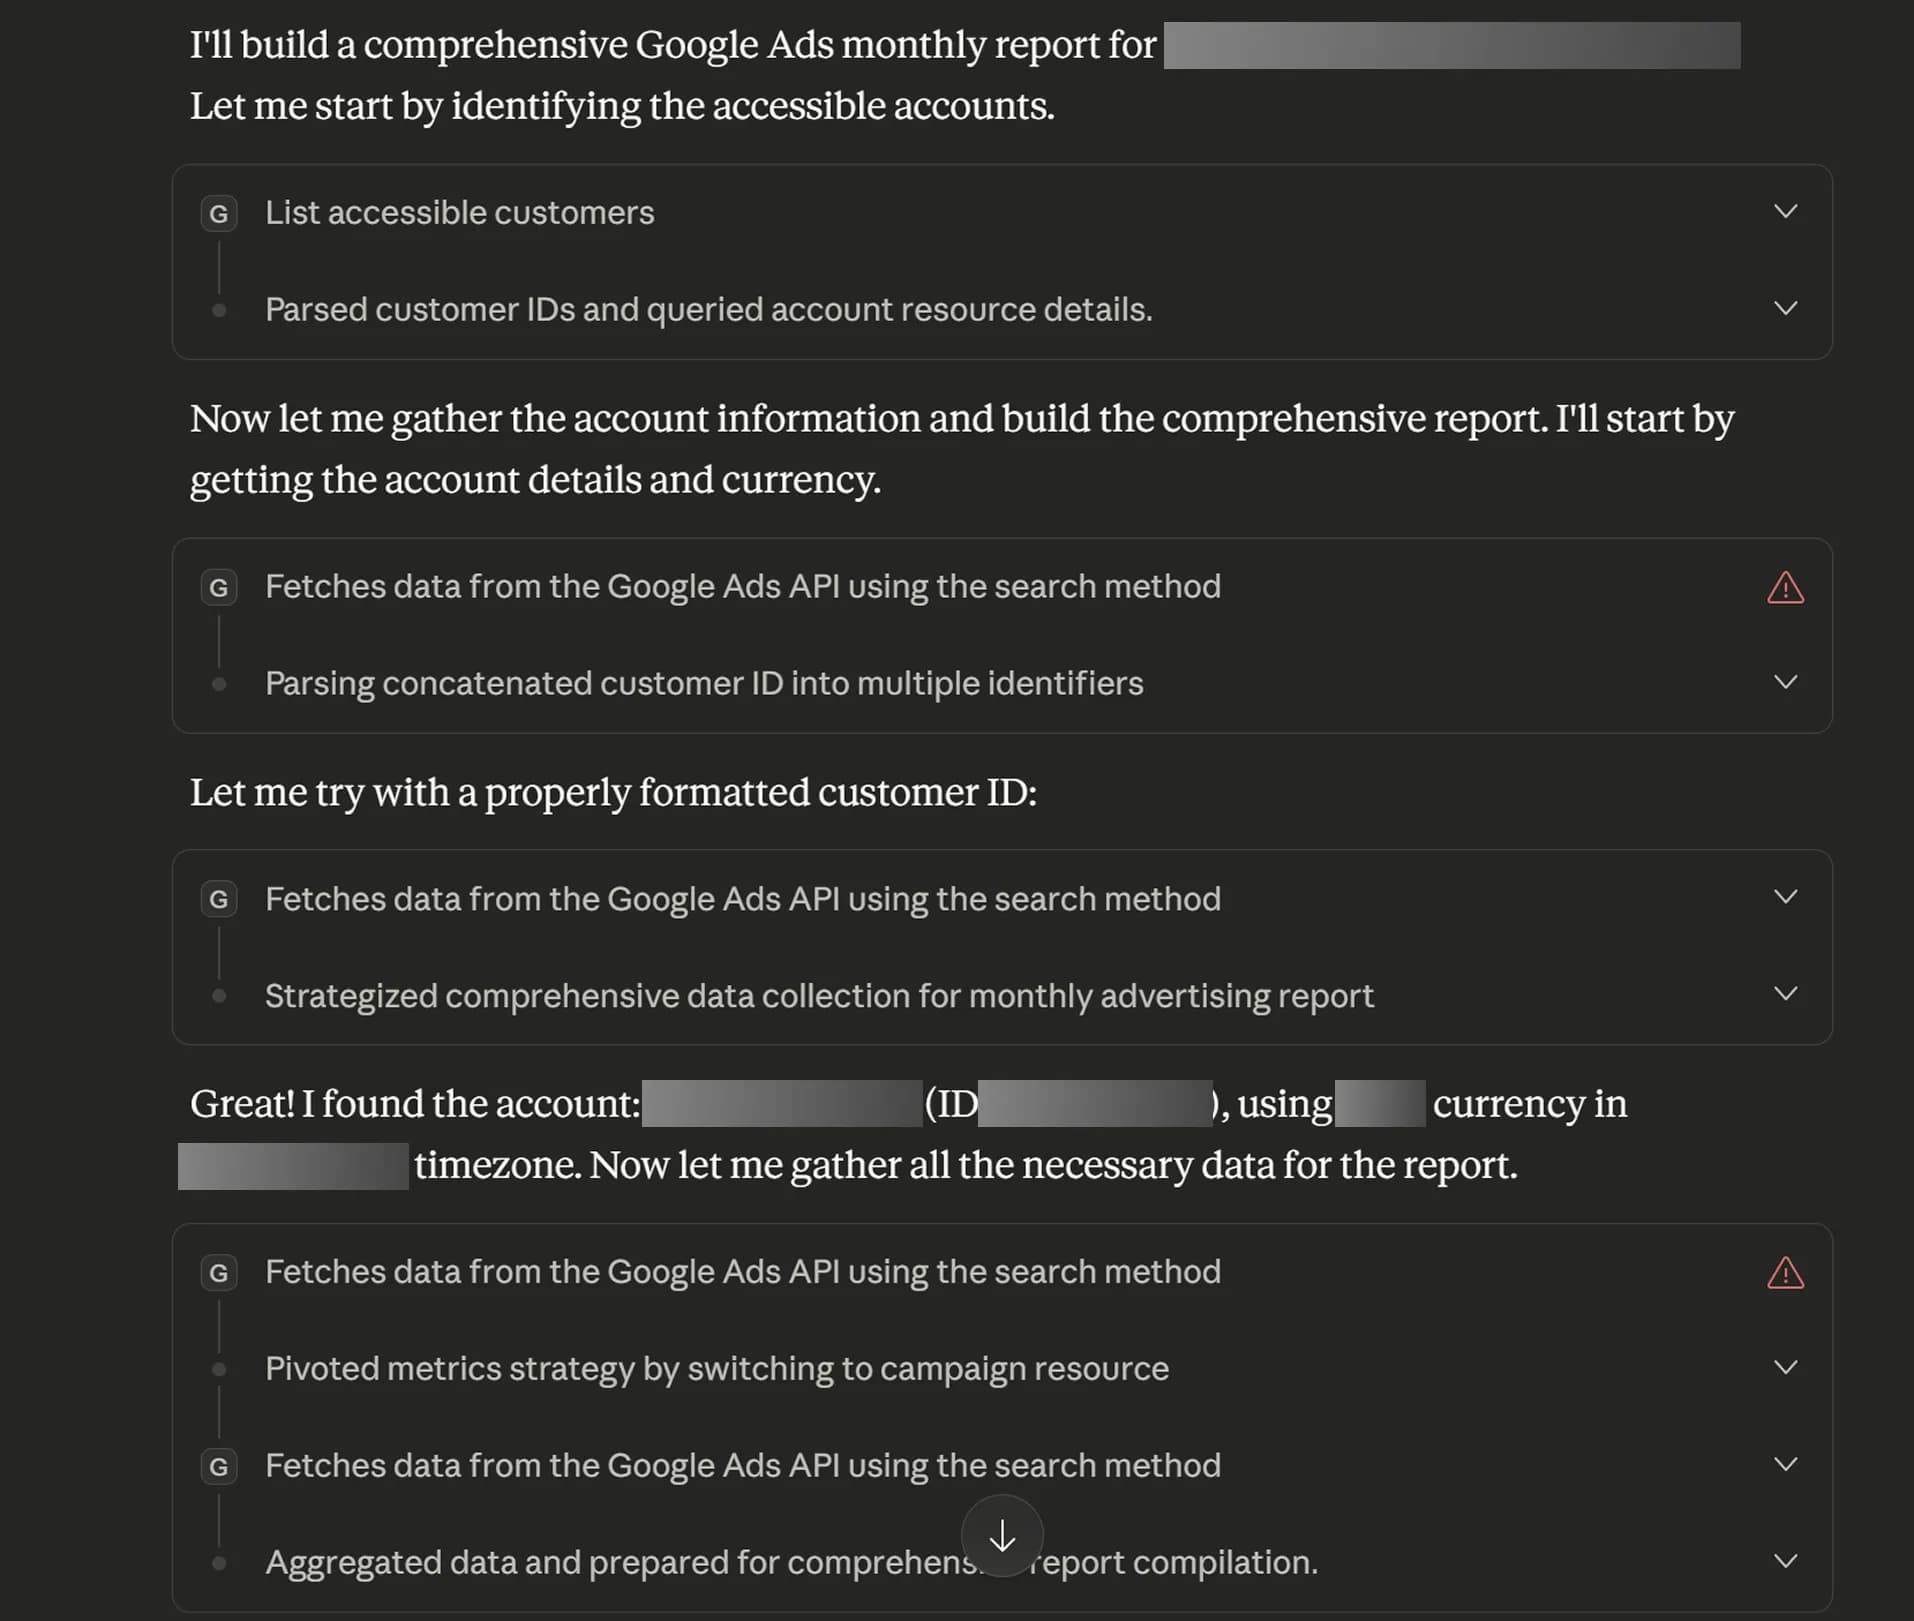
* For month-to-month comparisons, either run two separate date ranges or use segments.month segmentation with a segments.date filter.We pass this as an instruction to Claude and wait a bit (around 10–15 minutes) — yes, this is already a large report, and Claude makes many API requests to build it. In the screenshot, you can see only a small part (just what fits on the screen).
Meanwhile, while Claude is working — you can make yourself a cup of coffee, the work is in progress ;)
The result is a report like this:
Above — just a screenshot of a small part of the report. You can view the full report here.
Attentive readers may notice that this is already my third version of the report. I’m indeed not publishing the very first result. But the reason isn’t that the first result was unsuccessful. It’s all about data confidentiality. Since I’m working with a real project, I must ensure that no data is accidentally exposed. Therefore, the two iterations after the initial report were aimed at anonymizing and modifying some of the data.
By the way, that’s also the reason why some conclusions may seem slightly illogical — like “the conversion rate improved slightly from 1.89% to 1.81%.” The reason is the same anonymization: in some places, Claude changed only the numbers while leaving the text as it was. For the purposes of this article, I decided I could allow such inaccuracy as long as I note it here — just to avoid spending extra time fixing it.
And one more thing. Yes, of course, this report can still be improved. Personally, I’m missing some charts to visualize the metric dynamics.
Also, the data in the tables could be presented in a more readable way. But here the rule applies: as the prompt is, so is the result. So, really, it’s all in your hands.
Speeding up the resolution of ad-hoc tasks with Google Ads MCP
Okay, I hope that by this point you already understand that with Google Ads MCP, you can automate your reporting. But that’s not the only way to use it. Of course, you can also speed up the process of finding answers to your daily questions.
For example, here’s a prompt:
Use Google Ads MCP and specify during which hours we have the highest conversion rate.And the response:
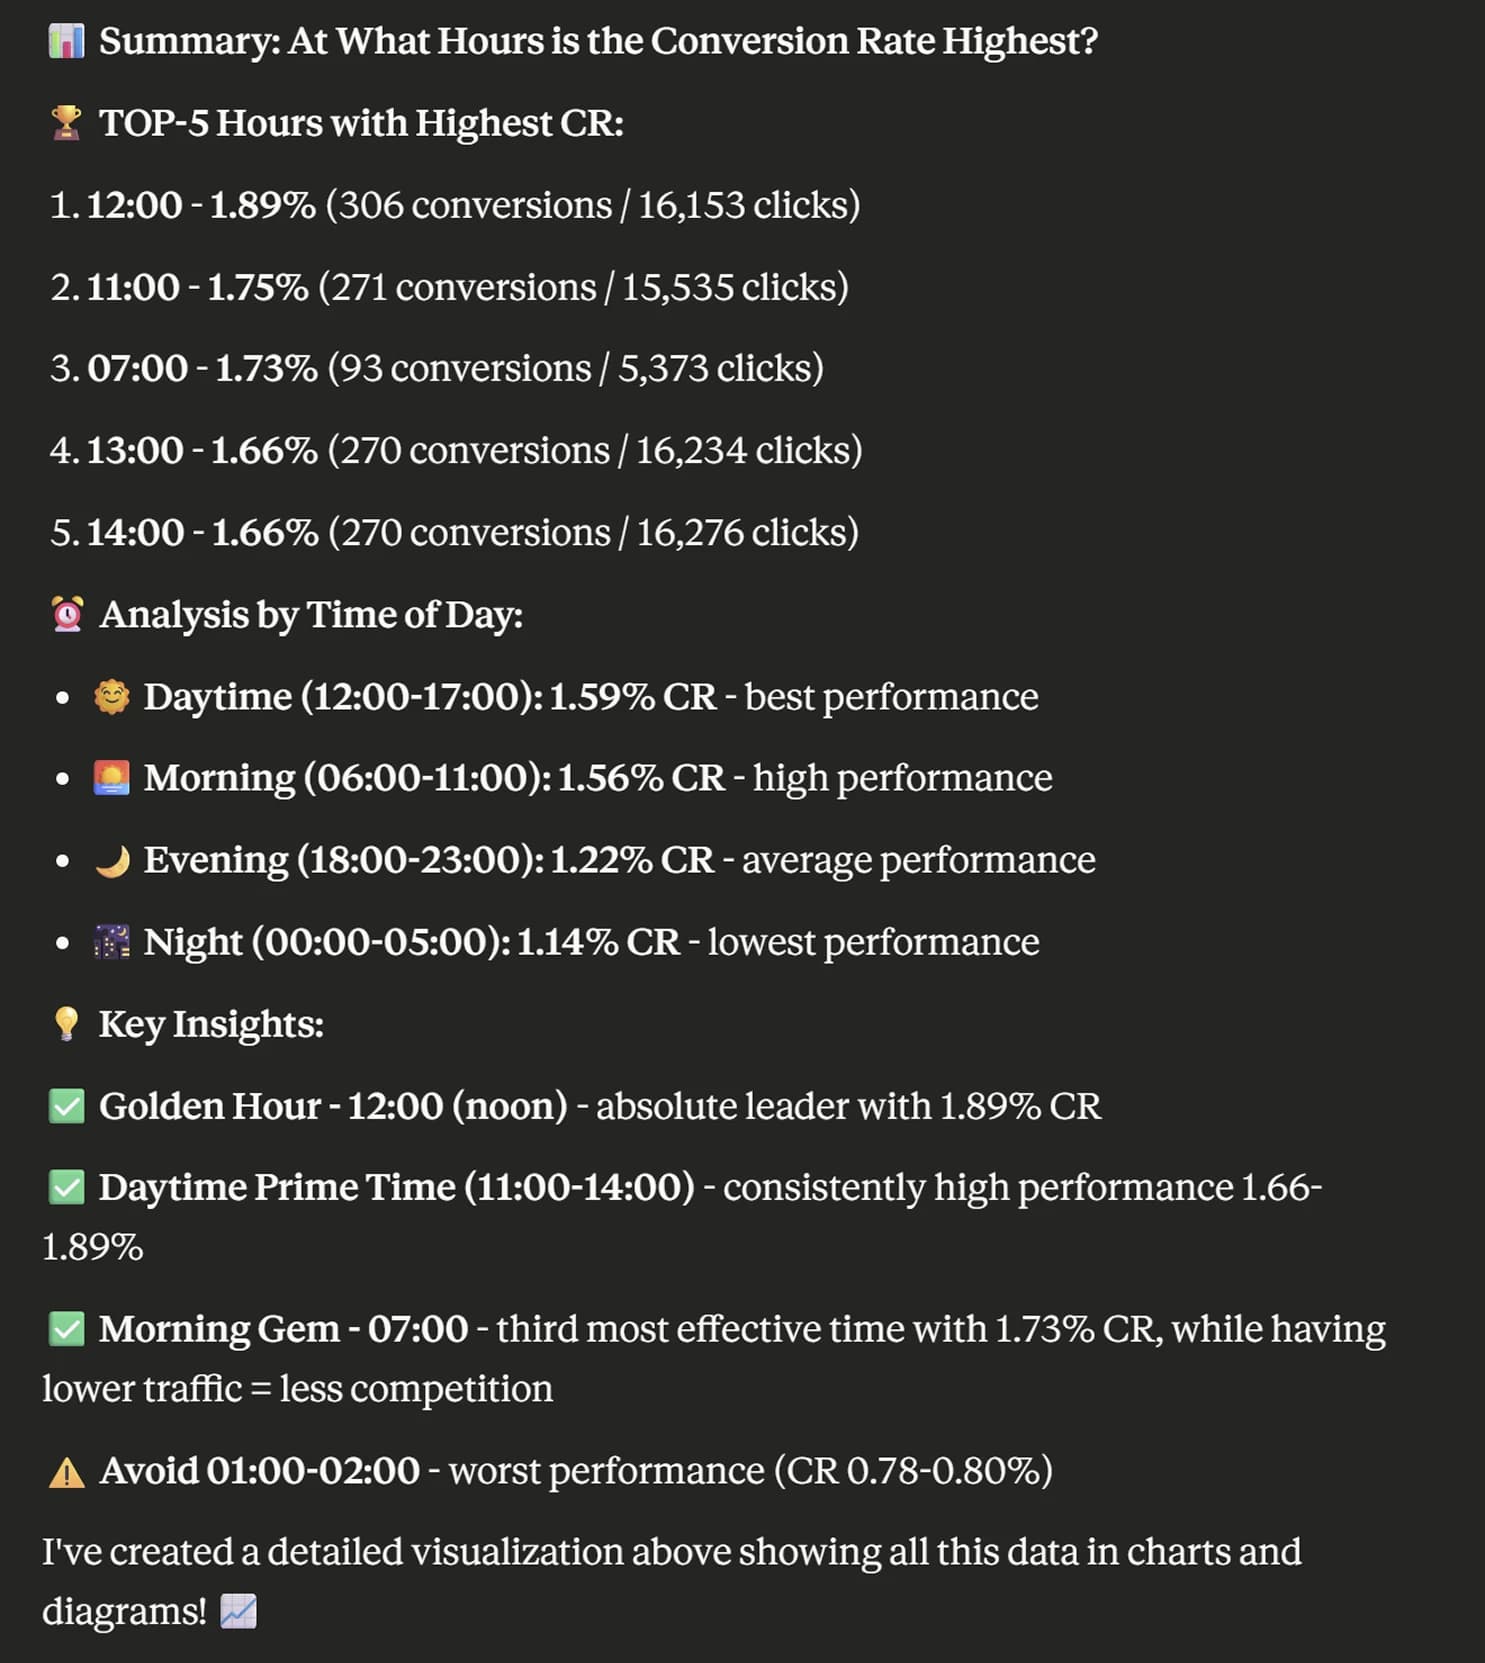
It even prepares a visualization for you:
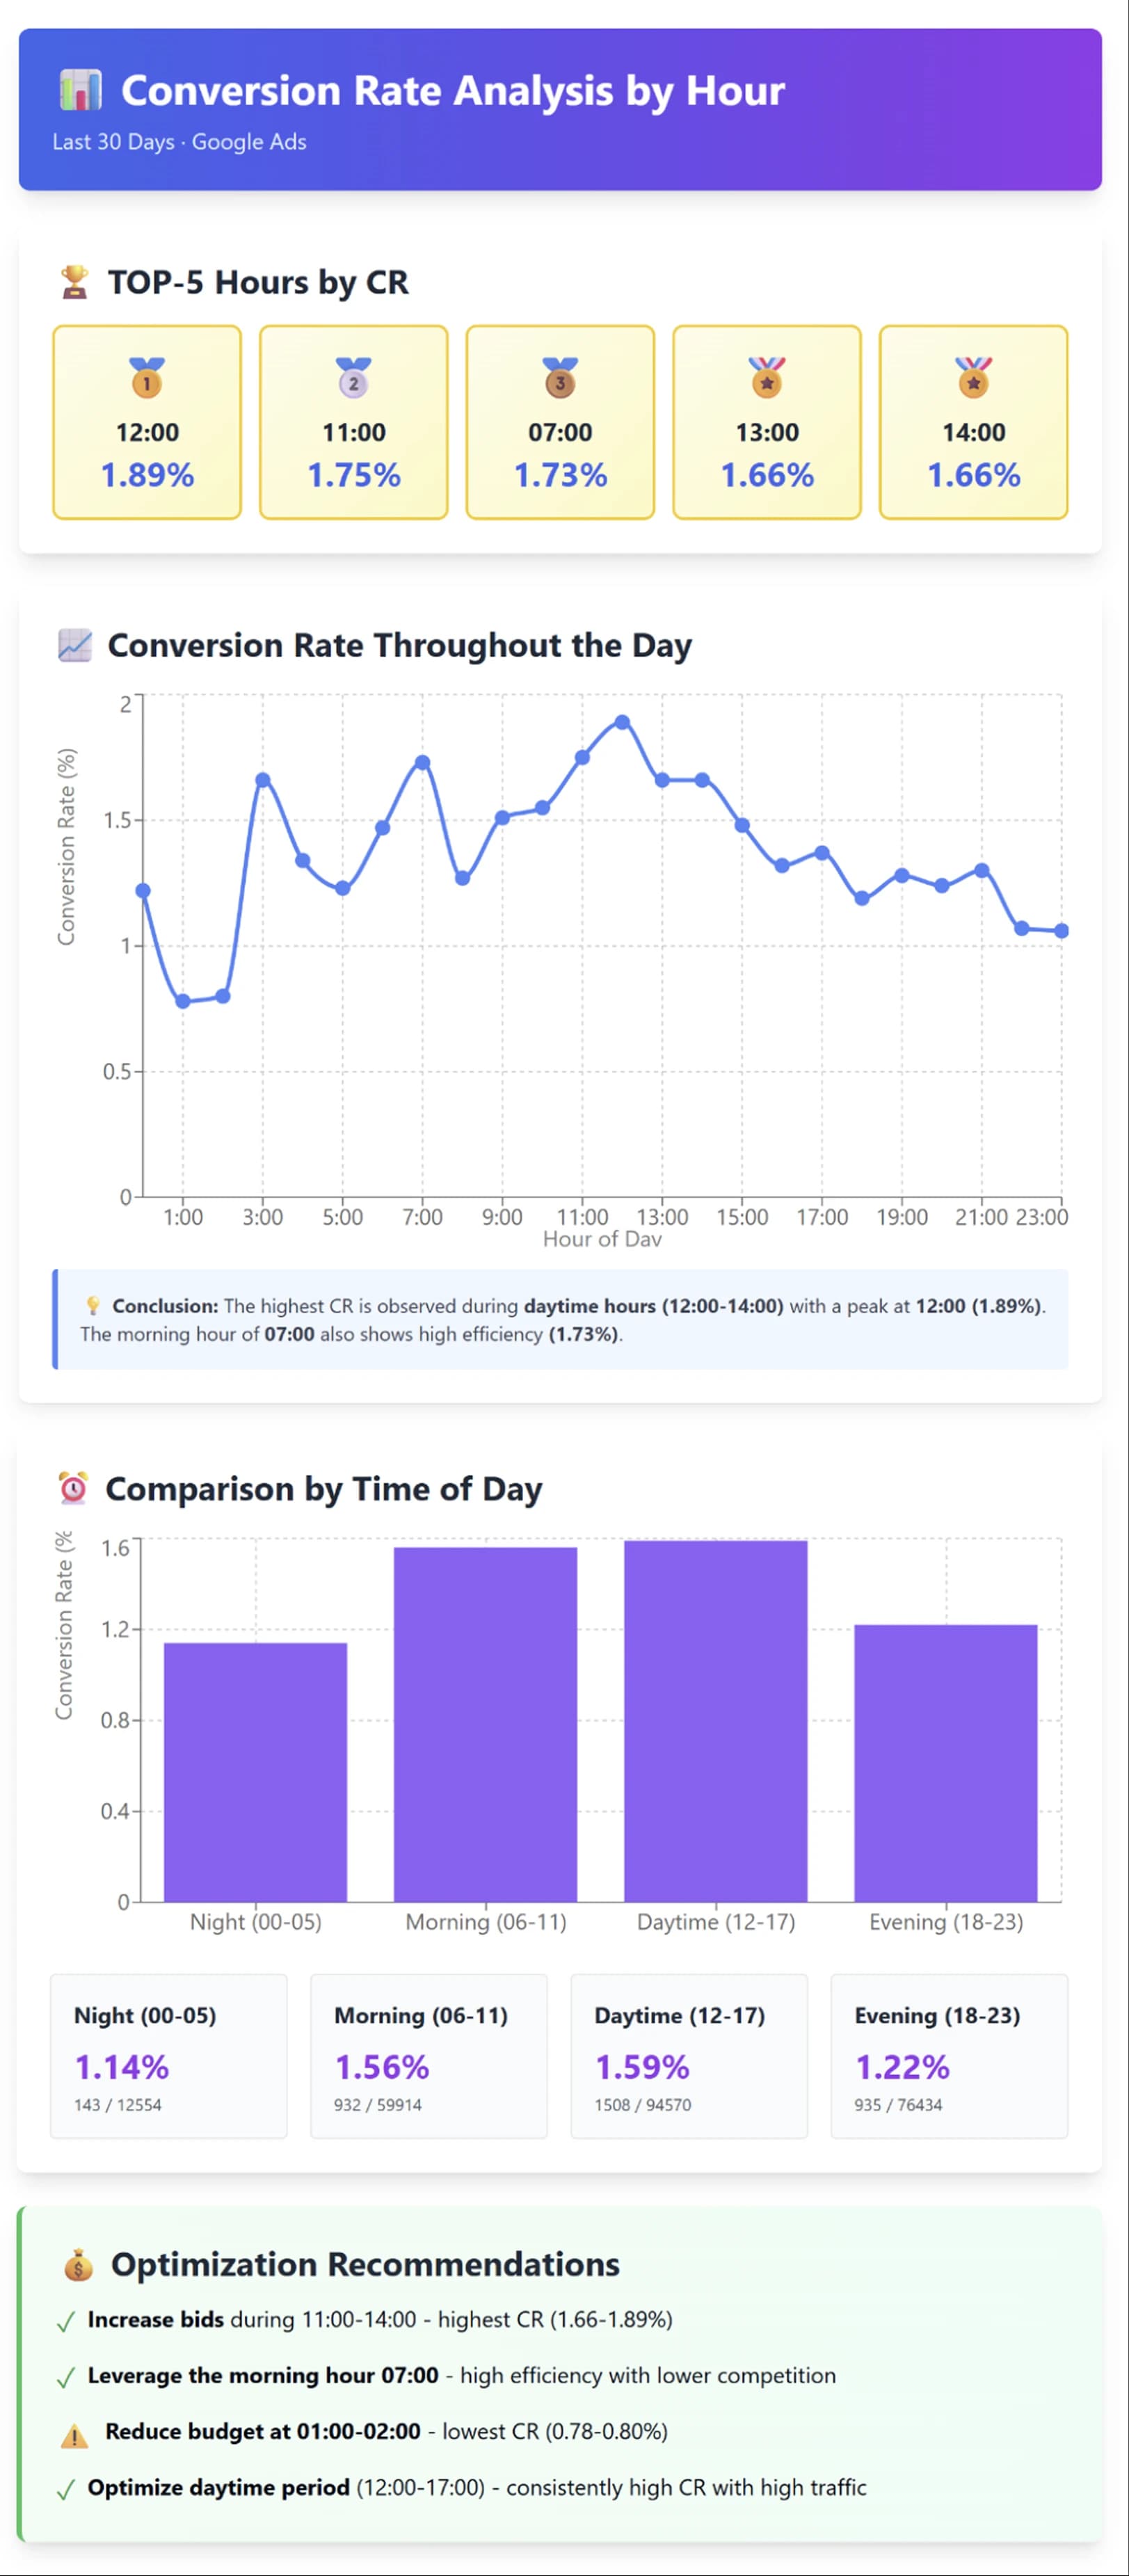
This way, it’s easier for you to interpret the data — and you can also send it to the client to justify your decision if necessary.
Instead of conclusions
A few words about the advantages of MCP
As you can see, the MCP technology, when used properly, can significantly boost your efficiency. What previously required building several dozen reports over an hour or two — can now be automated and completed with a single prompt, in 15 minutes — all while you’re sipping your coffee.
And it’s not just about Google Ads MCP. GA4 has its own MCP (I actually wrote about it earlier), as do BigQuery and Power BI. Many other systems already have it or are actively developing it — for example, Microsoft Clarity.
Now imagine being able to work with data from all these systems simultaneously, from the single interface of your favorite AI tool. And this system even knows your business context, because we can also connect it to local files or even Google Drive. Do you feel the potential here?)
A few words about the limitations of MCP
Of course, like any new technology, MCP has its constraints. I’d strongly recommend that you use only the read-only mode for now, even if the write/edit mode is supported.
In some projects, you may encounter difficulties when working with large datasets. For example, I received an error about exceeding result limits in one of my projects when using Google Ads MCP. But let’s be honest — even before, when working with large data volumes, some simple solutions didn’t work or worked with limitations.

There’s also, for instance, a major issue with the repeatability of results for the same prompt. If you try entering the same prompt from the section of this article “Building a monthly client report based on your own prompt and Google Ads MCP,” you’ll get a similar but not identical result.
In some cases, this can be useful — for instance, each client’s report will look slightly different, adding a sense of uniqueness. But in other cases, it can be inconvenient — giving the same client a monthly analysis that looks different each time isn’t exactly the best idea.
And finally — some closing thoughts
One way or another, every technology has its advantages and disadvantages. GA4 isn’t a perfect tool either, and I’m sure not every feature in the Google Ads interface is as convenient as it could be — but that in no way diminishes the usefulness of these tools.
I hope I’ve managed to convey one important idea: “Using MCP is something that’s already changing the market.” You either start learning and using it now — or you fall behind.
Why is that previous sentence so categorical? Because the market is changing, and part of the work can already be automated. If you’re still doing it manually, your efficiency is much lower than others’. That doesn’t mean it’s time to “go work at the factory,” of course not.
It’s just another reminder: in today’s analytical world, standing still while everything moves forward means falling behind. You either do things better or faster. But since we’ve already lost the race for speed to AI, our only path forward is quality and depth.
The analytics profession won’t disappear in the coming years — but it will definitely transform. And technologies like MCP will play far from the smallest role in that transformation.
And what do you think about using MCP in your work or business?
If you’re interested in discussing the practical aspects of implementation in your company — feel free to contact me personally.

Web Analyst, Marketer
Have thoughts or feedback?
Share with others and join the discussion.Loading comments…