
You’ve probably heard it a lot lately: ‘Google Analytics is outdated.’ Many have already seen this message in their account from Google:

Yes, even Google admitted that our beloved Google Analytics is outdated — and it’s time to move on to something new. There are many reasons for that, but the main one is the approach to data collection, which hasn't changed since April 2005, the moment when Google acquired Urchin Software Corp.
I actually discussed what exactly became outdated back in 2018 during PPC Day. Here's one of the slides from the conference:

User interaction with websites has changed a lot over the past 15 years. Continuing to measure engagement by session count and bounce rate simply doesn’t make sense anymore. And those who are used to that approach will now have to relearn how everything works.
I already wrote about why it’s important to start using Google Analytics 4 (formerly App+Web) as soon as possible in an article on Ringostat’s blog six months ago. The key reasons I highlighted back then:
- A new approach to data collection that better fits today’s reality
- The ability to start building historical data now
- Direct access to raw data via BigQuery
- A wide range of auto-tracked events in GA4 (formerly App+Web)
- New capabilities in the interface
But GA4 has been developing so rapidly that in this article I want to zoom in on that last point:
- A new approach to data presentation
- New metrics
- A new custom report builder
- One-click key event creation
- A redesigned segment and audience editor
Of course, this isn’t a complete list of updates — but these are the ones you’ll likely encounter first.
A New Approach to Data Presentation
In the previous article, the top reason I listed was the “new data collection method that fits current realities.” Naturally, this change also impacted how the data is visualized.
GA4 looks more like a colorful Google Data Studio or Power BI report than the classic Analytics we’re used to. The default “graph + table” layout is gone — now, depending on the report, you'll see more appropriate visualizations above the table.
For example, here’s how the Traffic Acquisition report looks now:

Just a quick glance tells you that most traffic comes from Direct, OrganicSearch, and Unassigned channels. Plus, you can immediately see the traffic trends for each of those channels.
New Metrics
In addition to a new approach to collecting and presenting data, GA4 brings a whole new set of metrics in its standard reports:
- Engaged sessions — sessions that lasted over 10 seconds, included a conversion, or involved viewing at least two pages/screens. Think of it as an updated version of the old bounce rate.
- Engagement rate — the percentage of engaged sessions out of total sessions.
- Engaged sessions per user — as the name suggests, the average number of engaged sessions per user.
- Average engagement time — the average time a user actively interacted with your site or app (i.e., when the browser tab or app screen was actually in focus).
Oh yes! Google finally heard us — and as Krista Seiden mentioned in her article, you no longer need to hack together custom tracking to measure time on active tab. GA4 does it for you. Unfortunately, there’s still no official definition of this metric from Google. - Events per session — another new metric that helps you gauge user engagement. It shows how many events a user triggered during a session.
New Custom Report Builder
This part of the interface update deserves a full article of its own, so here I’ll just go over the highlights.
The old My Reports menu item is gone. It’s now replaced with Explore and the Template Gallery (and yes, as you might guess — the Template Gallery offers ready-made report templates). At the moment, we mostly see templates from Google’s team, but I hope that user-generated templates will be added in the future as well.
Another notable change: report types have been renamed Techniques, which — if you ask me — reflects a major shift in Google’s approach to working with data. In the past, it was often enough to just open a report and read the numbers. Now, more and more, we’re encouraged to explore the data from multiple angles.
And GA4 definitely delivers on that front. It comes packed with exploration methods that go far beyond what was available in the old Analytics.

- Free form — This one will look most familiar if you’re used to classic GA tables. Though even here, the tables are much more powerful. For example, you can build a heatmap like this:

In fact, the table is just one of several available visualizations in this method:

- Table
- Pie chart
- Line chart
- Scatter plot
- Histogram
- Geo map
That means this very first technique already offers more data visualization options than the entire Custom Reports block in Universal Analytics ever did.
- Funnel exploration - FINALLY — this is now possible! In GA4, you can build any funnel you want. And they look really good, too:

But more importantly — they’re highly functional. You can now create a segment or an audience from any part of the funnel in just a few clicks.
More details on this can be found in the funnel section of this article.

- Path exploration - another amazing method for working with your data. While the previous report lets you build a funnel as you envision it, Path Exploration shows you how users actually experience your site.
For example, after viewing an article titled "Funnel Analysis in Google Analytics 4: A Detailed Guide," users typically take one of four main paths:- They go to the homepage — (hopefully to keep reading)
- They check out the article on scroll tracking
- They visit the PRO GTM course page — a great move if they want to level up their GTM skills

- Segment overlap is another interesting method. With its help, I can visually see the percentage of visitors to the PRO GTM course landing page who also visited my blog, and how many were completely unfamiliar with it.

- User explorer is essentially an updated version of the User Explorer report from Universal Analytics.

- Cohort exploration has been highly anticipated. I could say that a similar report existed in Universal Analytics — but let’s be honest, it was practically unusable. This new method, on the other hand, is a powerful marketing tool that allows you to set any condition for cohort membership, and any criteria for returning to that cohort.

- User lifetime is a brand-new method that lets you evaluate user value across different dimensions. For example, in the screenshot below, I can see that most users come to my blog via organic search. But the highest average engagement time comes from users referred by urlumbrella.com and proanalytics.academy.

One-Click Key Event Creation
This is one of those updates that makes you want to shout “YES! It finally happened!” And key event creation is no exception. Now, to mark an event as a conversion — all you need to do is flip a switch.
Seriously, how awesome is that?

New Segment and Audience Builder
And finally, the last feature update we’ll cover in this article — the new editor for creating segments and audiences.
First off, it’s worth noting that you barely even need the editor now —
you can create segments and audiences simply by right-clicking wherever needed (yep, you heard right — right-click now brings up a context menu with some pretty handy functions).
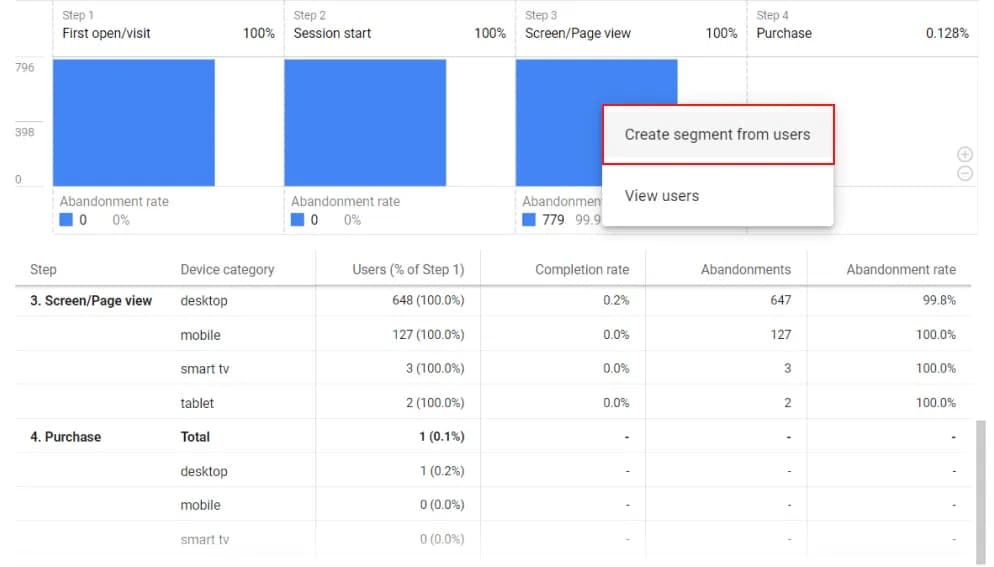
Then, in the pop-up window, just check the box to indicate that you want to create an audience, not just a segment.

Second, the segment creation interface itself — as you can see in the screenshot above — is now way more versatile.
Instead of conclusion
Google Analytics 4 is a huge step forward into the future of analytics. Still wondering if you should switch? The answer is a definite “Yes.” The data capabilities this tool offers are immense.
And by the way — I haven’t even started talking about working with BigQuery data yet...
Don’t hesitate to share your first impressions of upgrading to Google Analytics 4 in the comments, and also any challenges you’ve faced while working with this tool.
If you enjoyed this content, subscribe to my LinkedIn page.
I also run a LinkedIn newsletter with fresh analytics updates every two weeks — here’s the link to join.

Web Analyst, Marketer
Have thoughts or feedback?
Share with others and join the discussion.Loading comments…